When there is a big bearish pattern in your stock then it’s good to avoid parking more money in that and when all are in greed of making money in that share then you should be fearful, you have to one step above all these things and you will get idea of that only when you look into long-term charts of stock.
I added Vodafone Idea in my fundamental garbage list because of 3 reasons.
- Deteriorating Fundamentals.
- It is supporting my 4th point of garbage list conditions.
- Bearish Technical pattern, Rs 16 on cards.
Deteriorating Fundamentals: Huge change in Depreciation and Interest in last 2 quarter will put more pressure on PBT. Overall in the last 9 quarter “change % in OPM” was positive in one quarter only and rest of 8 quarter was in Negative %, and on the average basis there was 17%decline in OPM QoQ, and from Q3-2019 it will start posting Operating profit in negative values. ( operating profit is very important in terms of the financial statement).
Operating Profit = a profit from business operations (gross profit minus operating expenses) before deduction of interest and taxes.
It is supporting point 4 of garbage list conditions: As per my garbage list I have 6 points, if all 6 points are confirming then it’s a Garbage share, if only 4 are confirming then it’s a Fundamental garbage share.
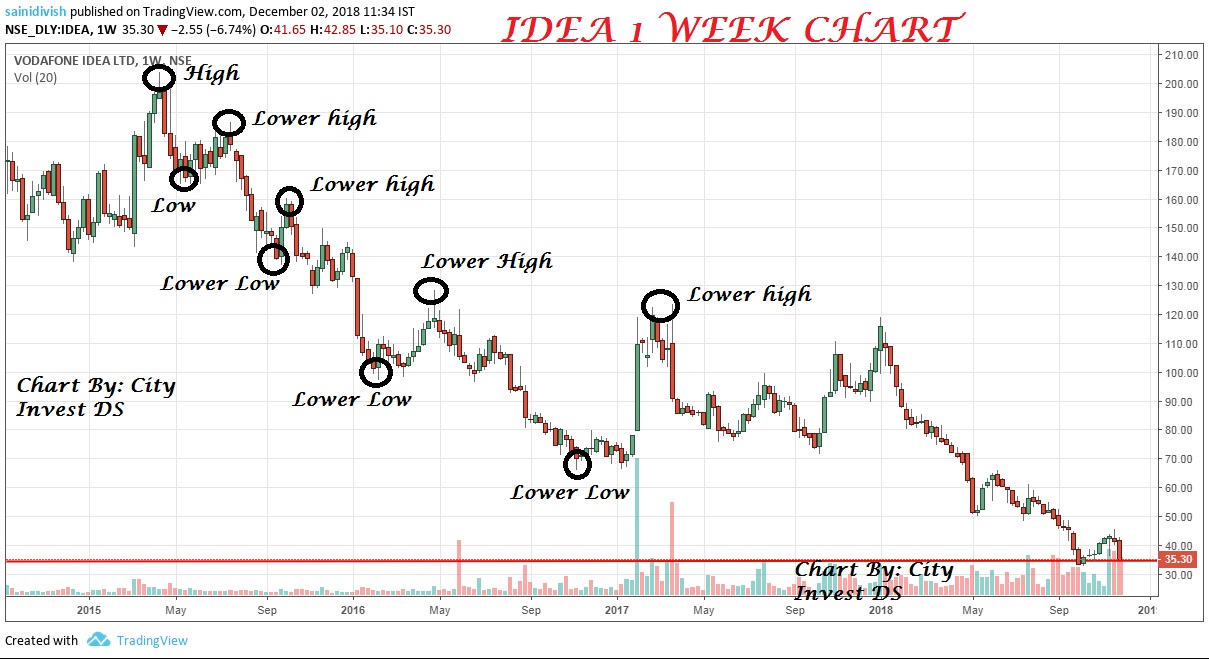
My point no.4 indicates that when a stock is not breaking previous high in last 4 years then it will be in radar to get shifted in Garbage list. In this case, I take help of Technical to get my answer.
In the above chart, you can see the price is not able to break previous High, and on a continuous basis it is breaking low, that’s a big bearish setup in formation, and for the very long term, it can be a single digit share. No Investment in this, please.
Bearish Technical pattern Rs 16 on cards: Whenever these kinds of the Bearish pattern is there in the market then it will first try to hit the respective target and now share price is on the way to hit Rs 16 before may 2019.
A big Rectangle pattern was there in Vodafone Idea and in April there was a Breakdown at Rs 70.
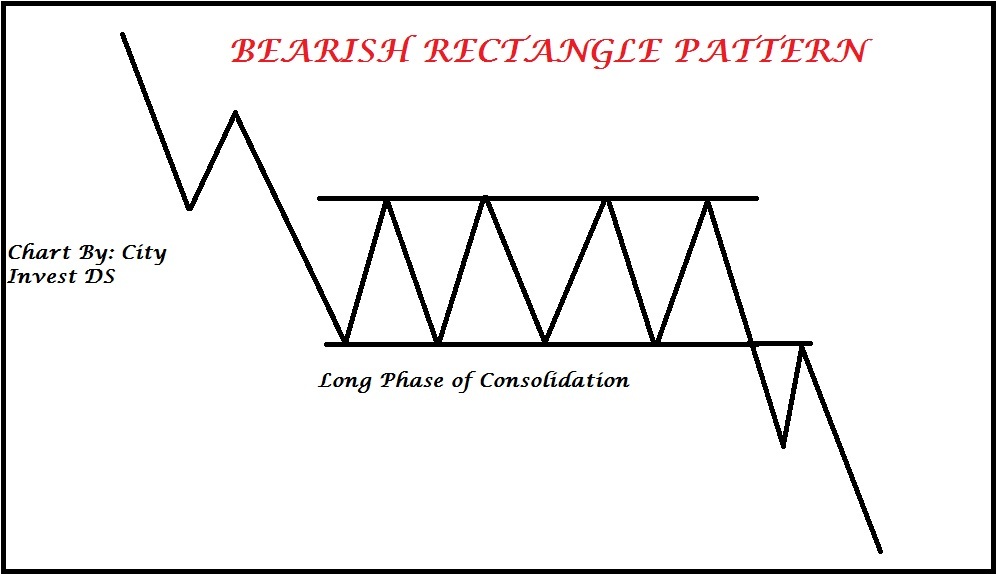
In Technical “Rectangle pattern” is one of the powerful pattern, if that forms in long term basis then it will change whole story of share. A big phase of consolidation and then breakdown, first it will trap people in between consolidation phase then it will go down with very high speed and will not give you a chance to think or to sell.
Here’s how Rectangle pattern looks like ( it’s a Continuous- Consolidation pattern)
Now the Same pattern is there in Vodafone Idea, started on April 2016 and ended on April 2018.
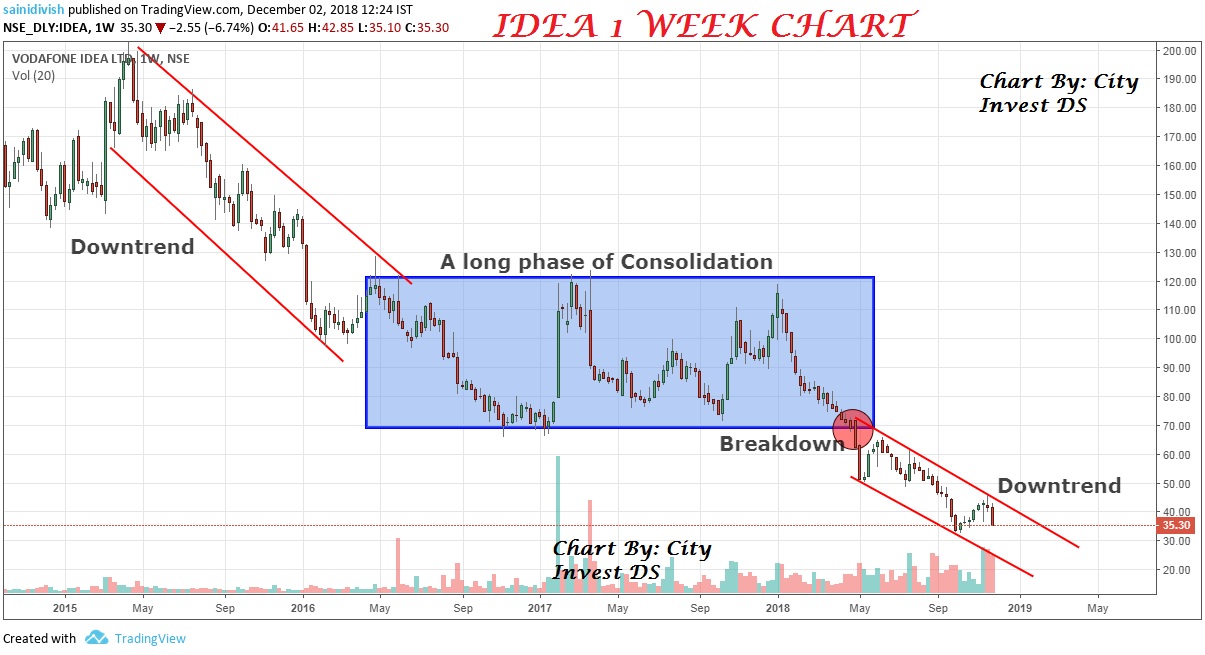 Meanwhile, it’s in a downtrend but a small rally may be there to trap more retailers, If you are good in short-term charts then plan your entry or exit, otherwise no need to Invest in this.
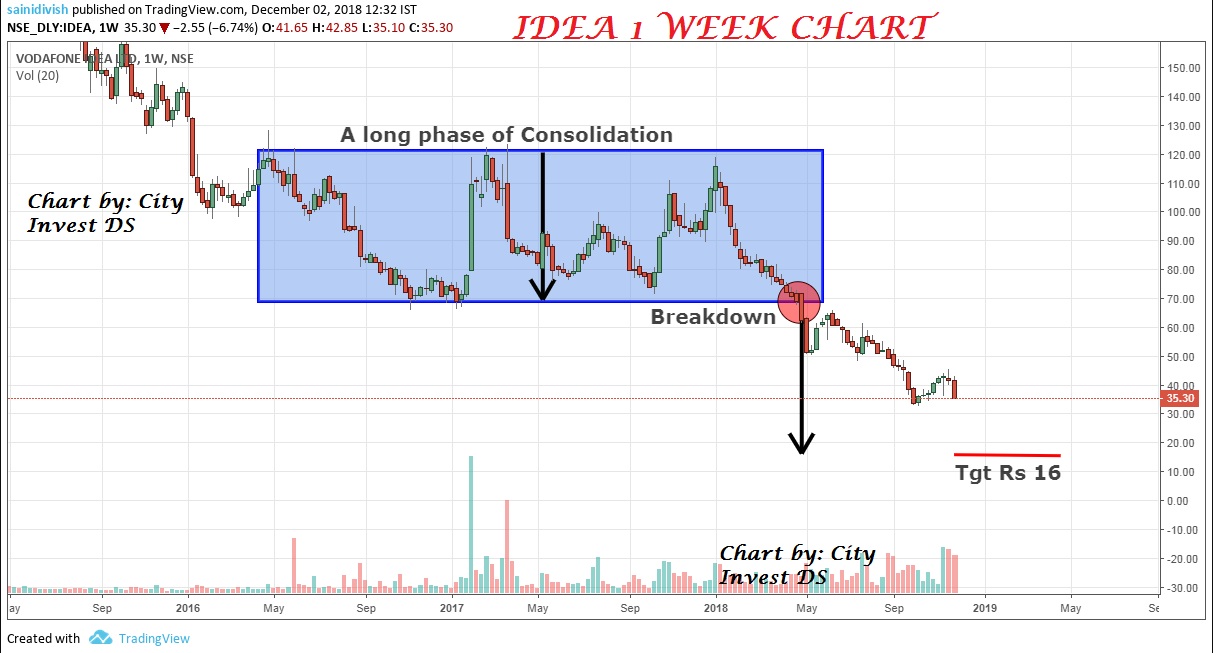 Expecting it to hit Rs 16 near April-May 2019, but before that, some huge volatility will be there.
Disclaimer: This information is for Investment purpose only not a short-term view, one who understands the importance of the Weekly chart can understand it in a better way.
sharing is caring, share it now.
