Last 20 Months Full of Bear Market in Midcap and Small cap Index. But now things are changing, Sign of Reversal is Just Just Near. But Don’t expect huge rally in short term, Slow process but worth of taking risk.
This information also for those who are holding Midcap and Small cap Mutual funds to continue to Hold, Rally to start soon.
Bull & Bear Market gets divide into 3 parts, so if we check whole trend of last 4 years starting from 2016, we can easily categories 2016-2017 as a Bull Market and 2018-2019 as a Bear Market. But How Bull Market Changes into Bear Market? Let’s have a look into below Information.
2016-2019 Bull Bear Market Case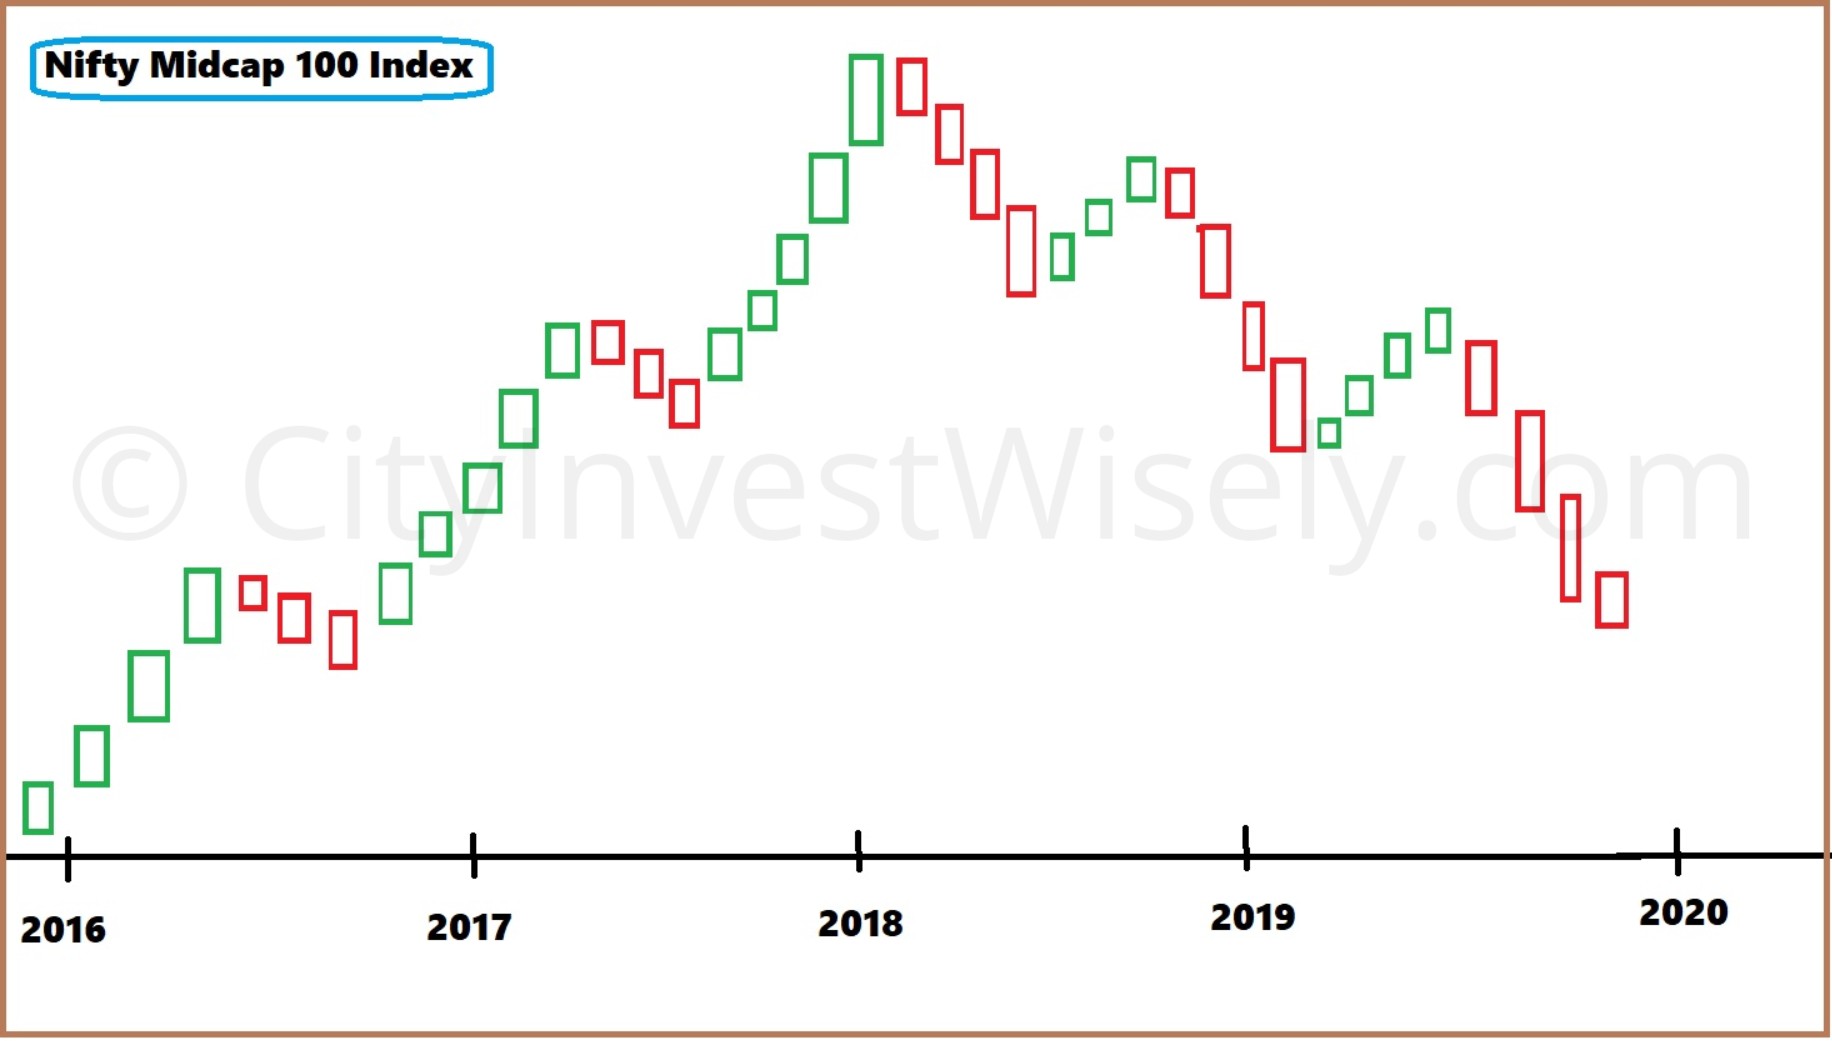
The Interesting case Is When ever a Bull Market Rally starts, it get divided into 3 parts and same with case of Bear Market, It get divided into 3 Leg selling. Below you can see the actual Market charts of Midcap 100 Index.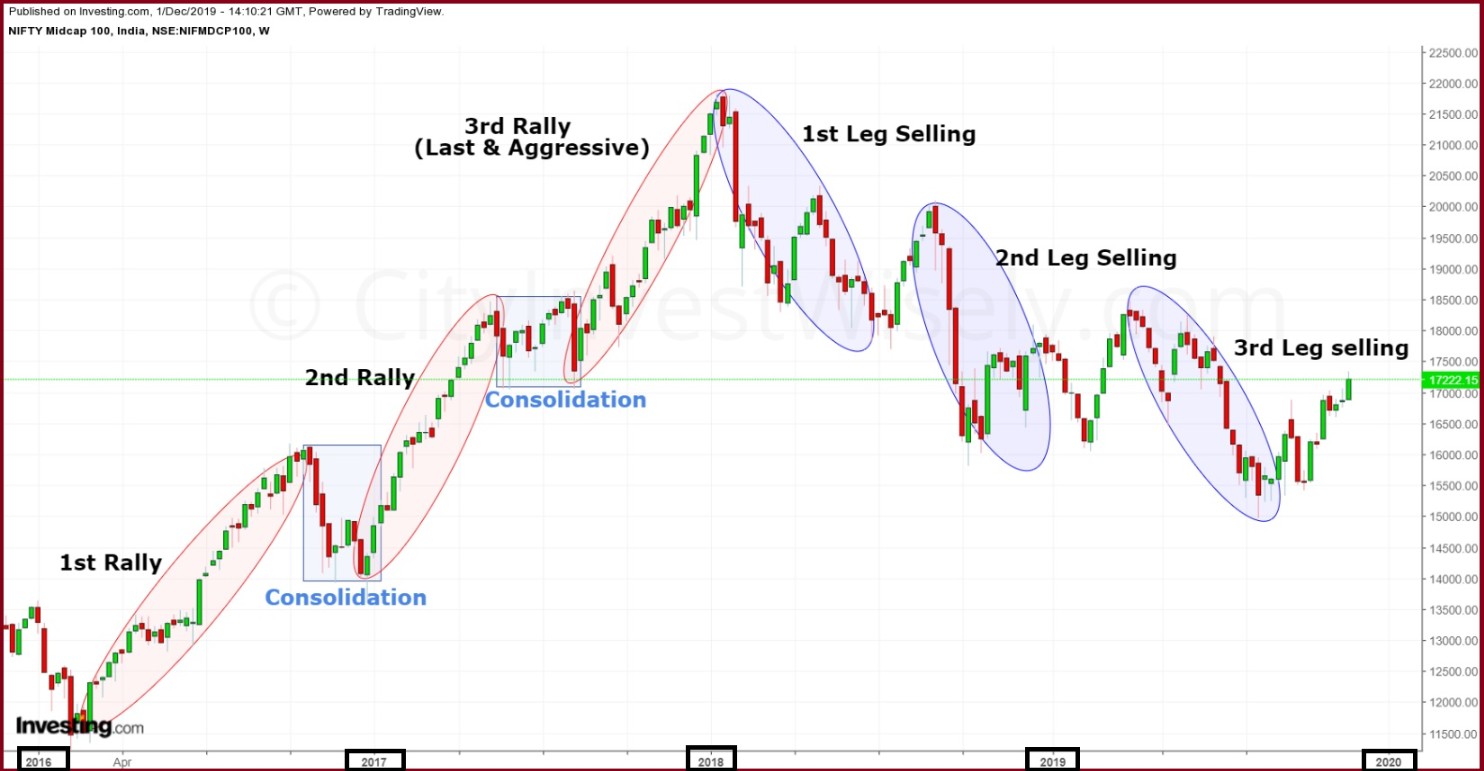
That’s the classical Setup of Market, where market goes up in 3 steps and comes down in 3 steps, If you check all the Rallies in Market or Any asset you will get to know about this classical setup, That’s a Weekly chart so overall process is lengthy.
In Bull Rally, price never closes below Half of the rally & It continues to hit new high Like in below Chart. 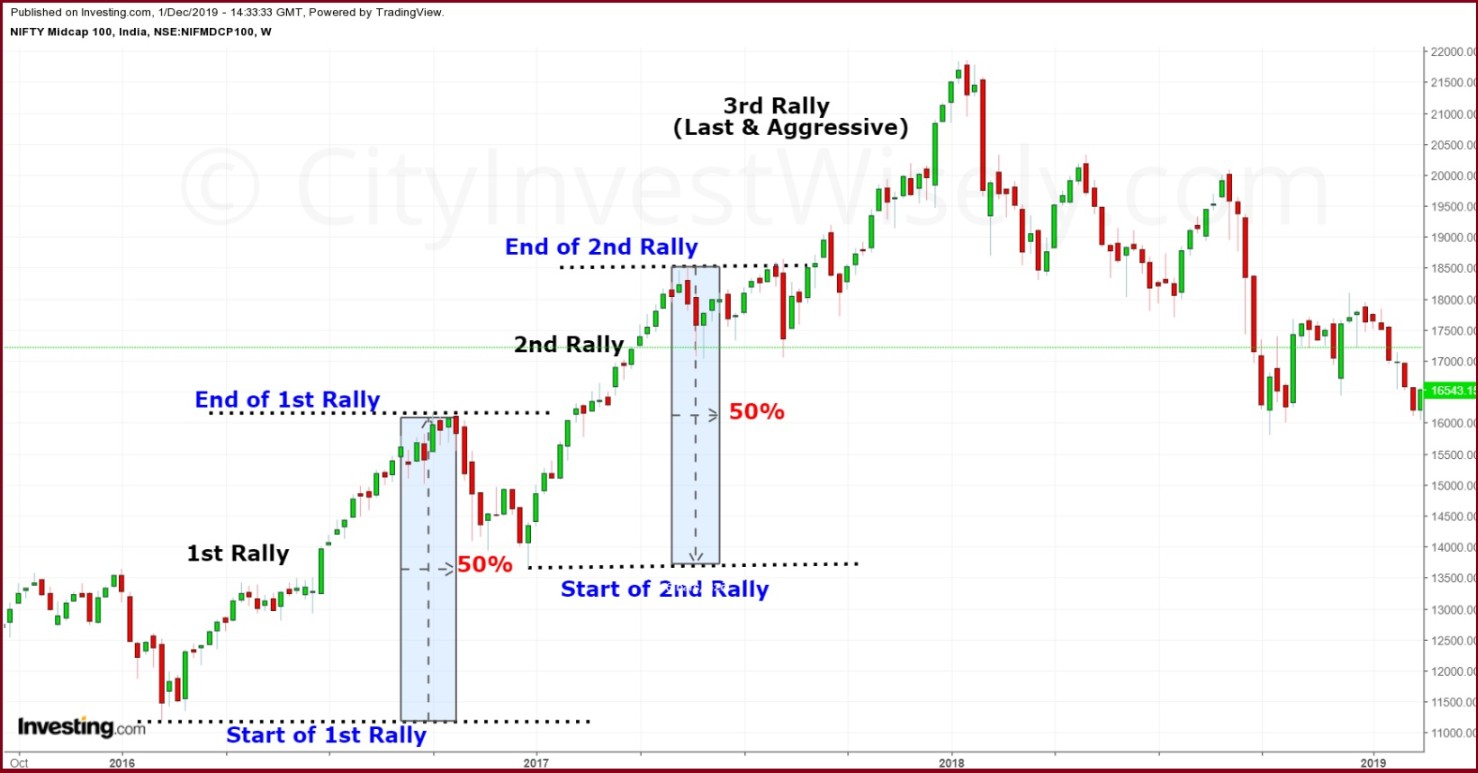 First 2 Bull Run Rally sustain because Price never closes below of 50% of Rally & Price continue to Mark new high. All details are marked in the Above chart.
But things got Change after 3rd Rally, 3rd Bull Rally is Always the last one and the Aggressive one, where every one wants to participate the rally and that create a TOP of the market and the moment Price closes below the 50% of the Rally that means Market Reversal starts and that’s the starting phase of Bear Market.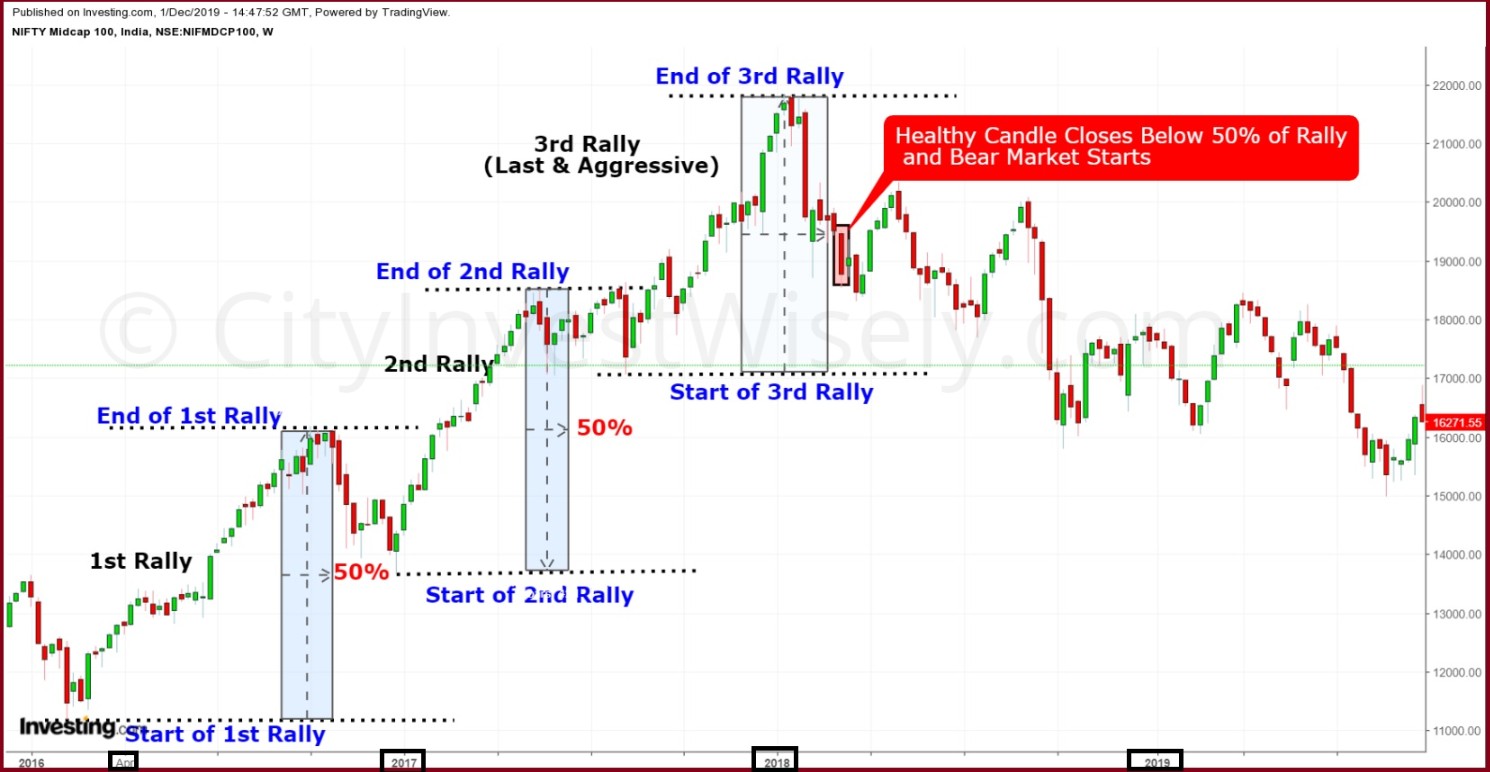
A full Healthy Candle have to Break the Trend of Market, Here we are using Weekly chart, So A Proper Candle which is opening below 50% and closing below 50% Mark is needed to check the Reversal. So we got that on 5th March 2018.
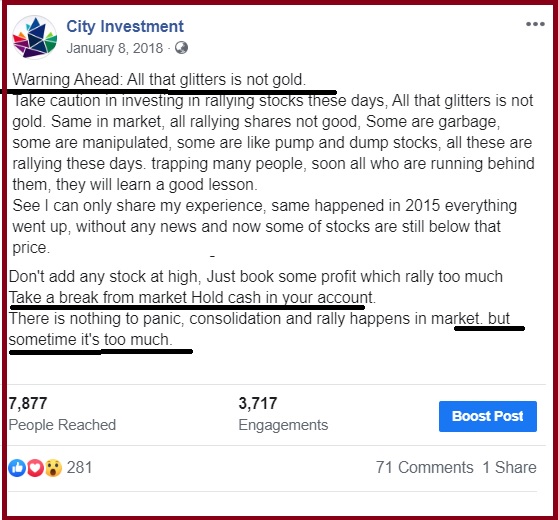
As Market reached the TOP, I alerted about that in January 2018 on My Facebook Page.
On January 2018 We got TOP Reversal & Now after nearly 23 months (700 Days) We got BOTTOM Reversal Signal of Midcap 100 Index. Don’t expect that Market will turn bullish in 2-3 days, it’s a Weekly chart so slow process of Consolidation and pullback will be there, then step by step Rally will start again.
For Bottom Reversal we Will apply the same Setup like we did with Bullish case. By Checking if Market Breaks the 50% Fall part.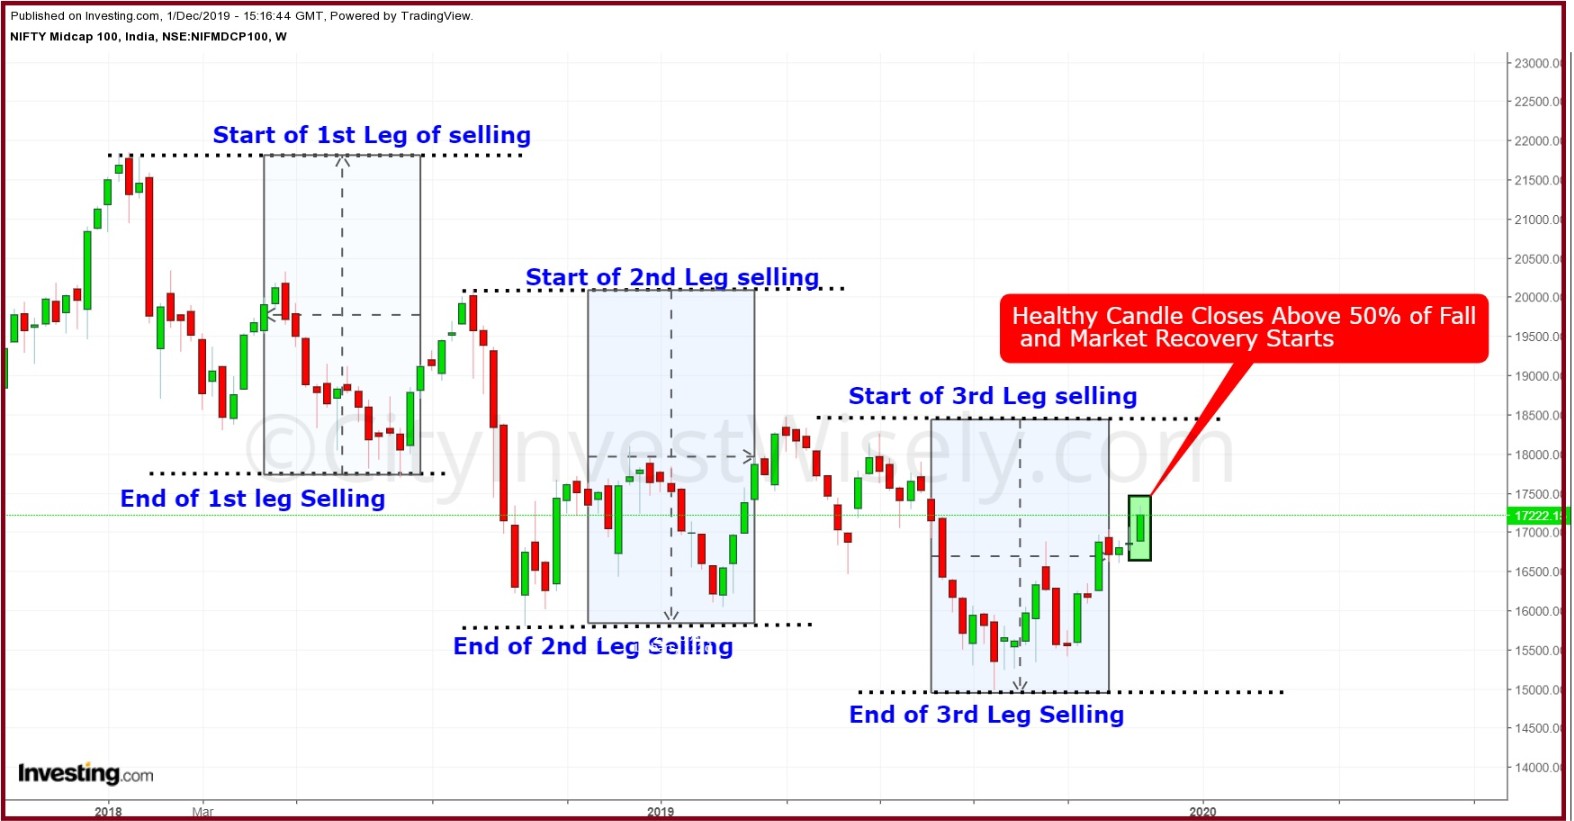
Now We got a Healthy Candle which Opens above 50% and closes above 50% of 3rd Leg fall. So now BOTTOM is confirmed, But some pullback may be there, Don’t expect huge rally, market goes into trend always, so trend like rally and consolidation and some pullback and same repeats again.
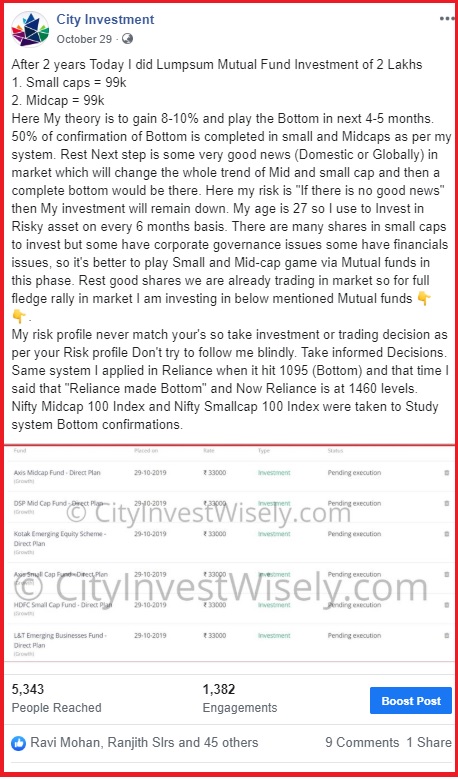
1 Month ago my trading system predicts the Complete Bottom of Midcap & Small cap and I purchased Lumpsum Midcap & Small cap Mutual Funds on that Basis on 29th October 2019.
Lumpsum Midcap and Small cap Mutual Funds Bought on 29th October and Current Price. I am waiting for Midcap 100 Index to hit 18350 levels in next 3-4 months, Right Now Midcap 100 Index is at 17250, so Rally upto 6.3%. A good Weekly close above 18400 then Rally will continue to 20k.
Continue to Hold your Midcap and Small cap Mutual Funds.



7 Comments
Hey Divish, Fantastic article from your end… Seriously amazing observation skills. Healthy candle closing below the 50% of the rally where the downfall begins and vice versa too good. Is it a chart pattern, I found it to be your own creation, which makes hell lot of a sense. Amazing piece as always from your end! You have cautioned at the top and now you are advising for investing at the start of the recovery phase. Thanks for enriching and enlightening us at timely intervals.
Thank you for sharing yet another brilliant article… 👍
Thanks 🙂
Great article. Keep it up.
Thanks 🙂
Very informative and Intresting observations, thank you for sharing !
Thanks 🙂