M&M is an overall good company, but recent sell-off in the market will push the price of M&M much lower to Rs 640 levels.
I have three reasons to Justify Rs 640 Target in M&M, Overall it will take near about next 4-6 weeks to hit our target.
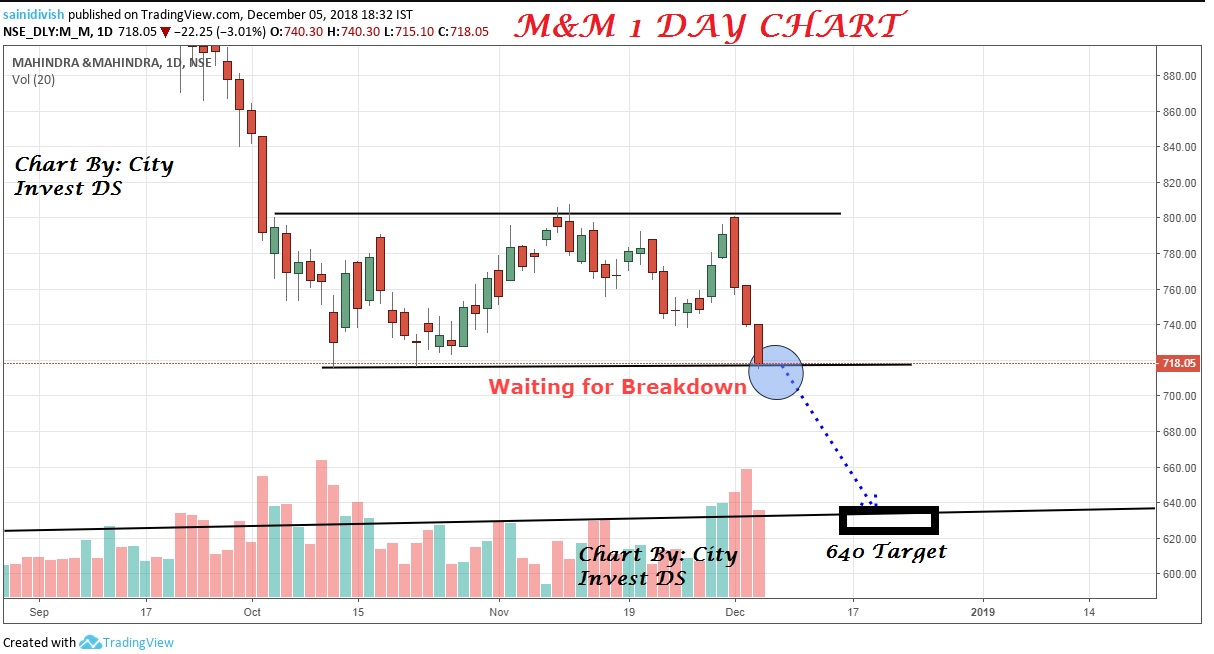
Rectangle formation
For this, we have to wait for closing below Rs 715 as per daily charts. once we get our condition of closing one single candle below 715 then we can take our trade easily for a target of Rs 640. Long Term Support Line
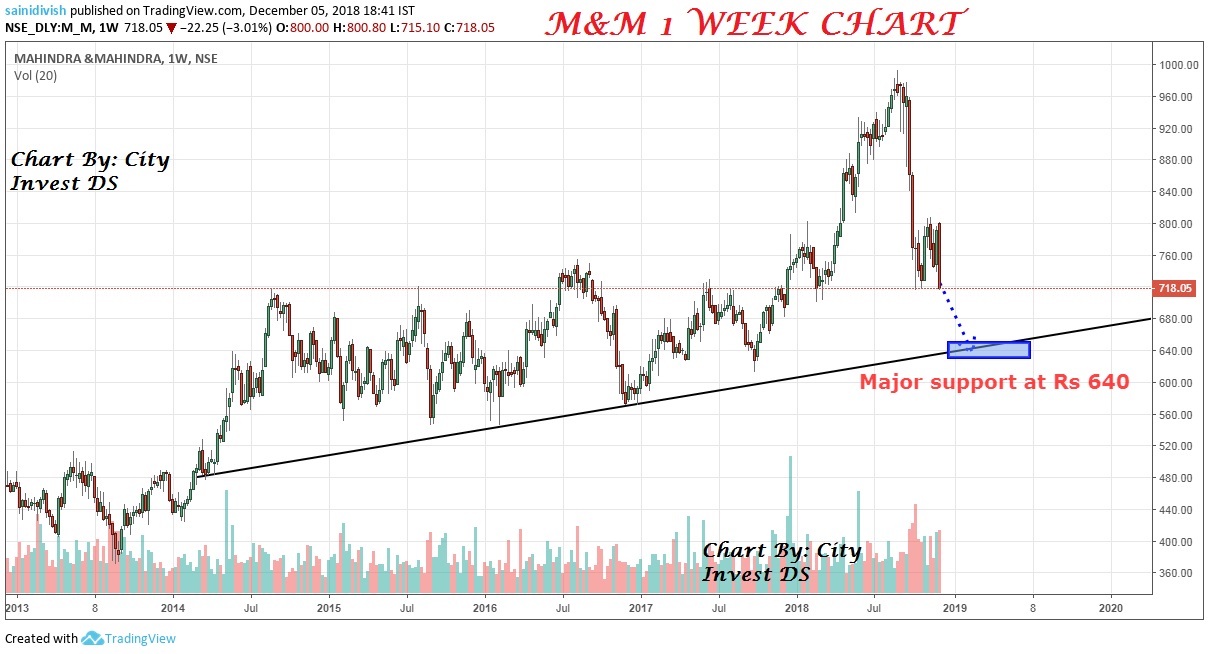
Overall long-term support line will provide good support to M&M near Rs 640 levels. This line started from 2014, so it’s a kind of Major support in the market. Bearish Engulfing
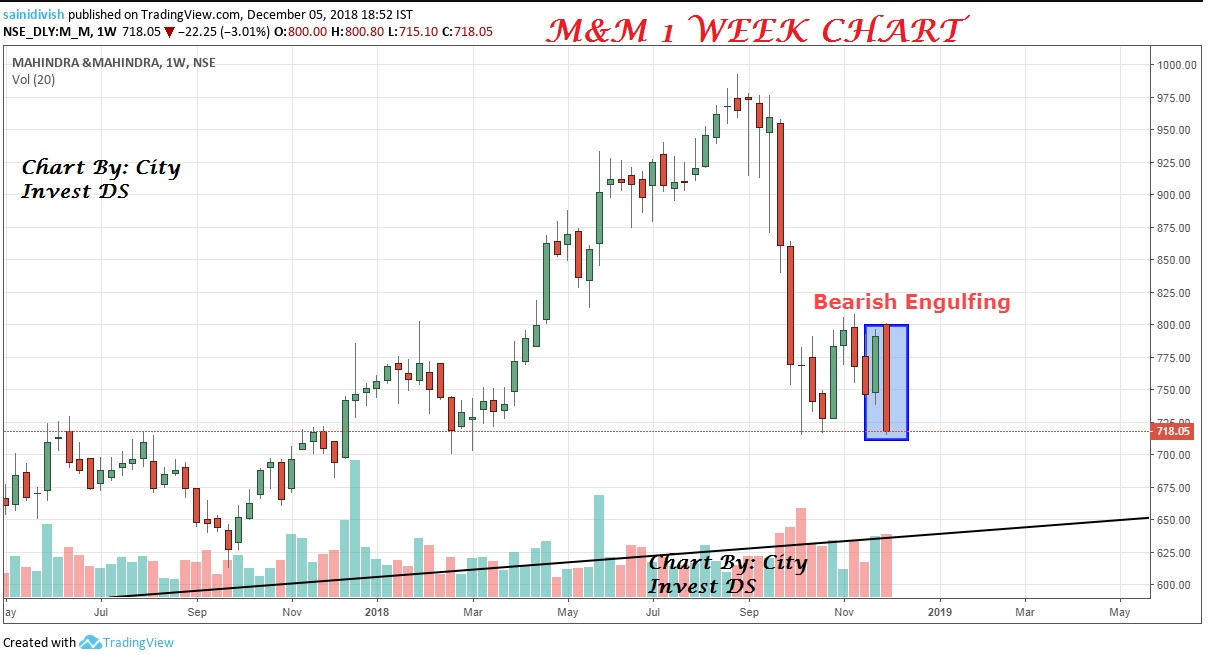
Bearish Engulfing is one of the important and powerful patterns Market. If that forms near Resistance then it will surely a game changer for Stock Price, And the target of Bearish Engulfing we are getting is near Rs 640. But for confirmations, we have to wait till Friday.
Conclusion: Sell M&M On Friday if it’s in between a range of 740-700, for a target of 640, if this level is confirmed then we can take selling trade. OR If M&M closes below 715 on any single day then we can take selling trade for target fo Rs 640. If there is no confirmation then it will remain in the range of 800-715 only. I will update my trade on my telegram channel t.me/cityfno
By Applying technical we can judge a share price movement, but you have to draw good charts, otherwise no need to take trades.
Share this information, It will help many trades/Investors to get more knowledge about a trade.


5 Comments
Very useful article and specially for those who are new and want to do something in market…
No one do such work without any expectations
Thanks 🙂
Its very useful to see your concepts learned in TA class applied in practical examples…!!!!
Keep it up brother..!!!
Yes learning matter the most in the market, Will keep improving all these things, thanks 🙂
Pingback: Bearish Continuation Patterns - City Invest Wisely